Swiss-PO
Introduction to Swiss-PO
Here you will find a tutorial and videos to guid and help you perform mutation analysis.
In the following, we provide a step-by-step example on how to analyze a mutation using Swiss-PO. As an illustration, we will consider the FGFR2 p.D283H mutation, which involves the substitution of aspartate (D, Asp) with a histidine (H, His) at position 283 of the sequence of the Fibroblast Growth Factor Receptor 2 (FGFR2) protein.
Initial Steps
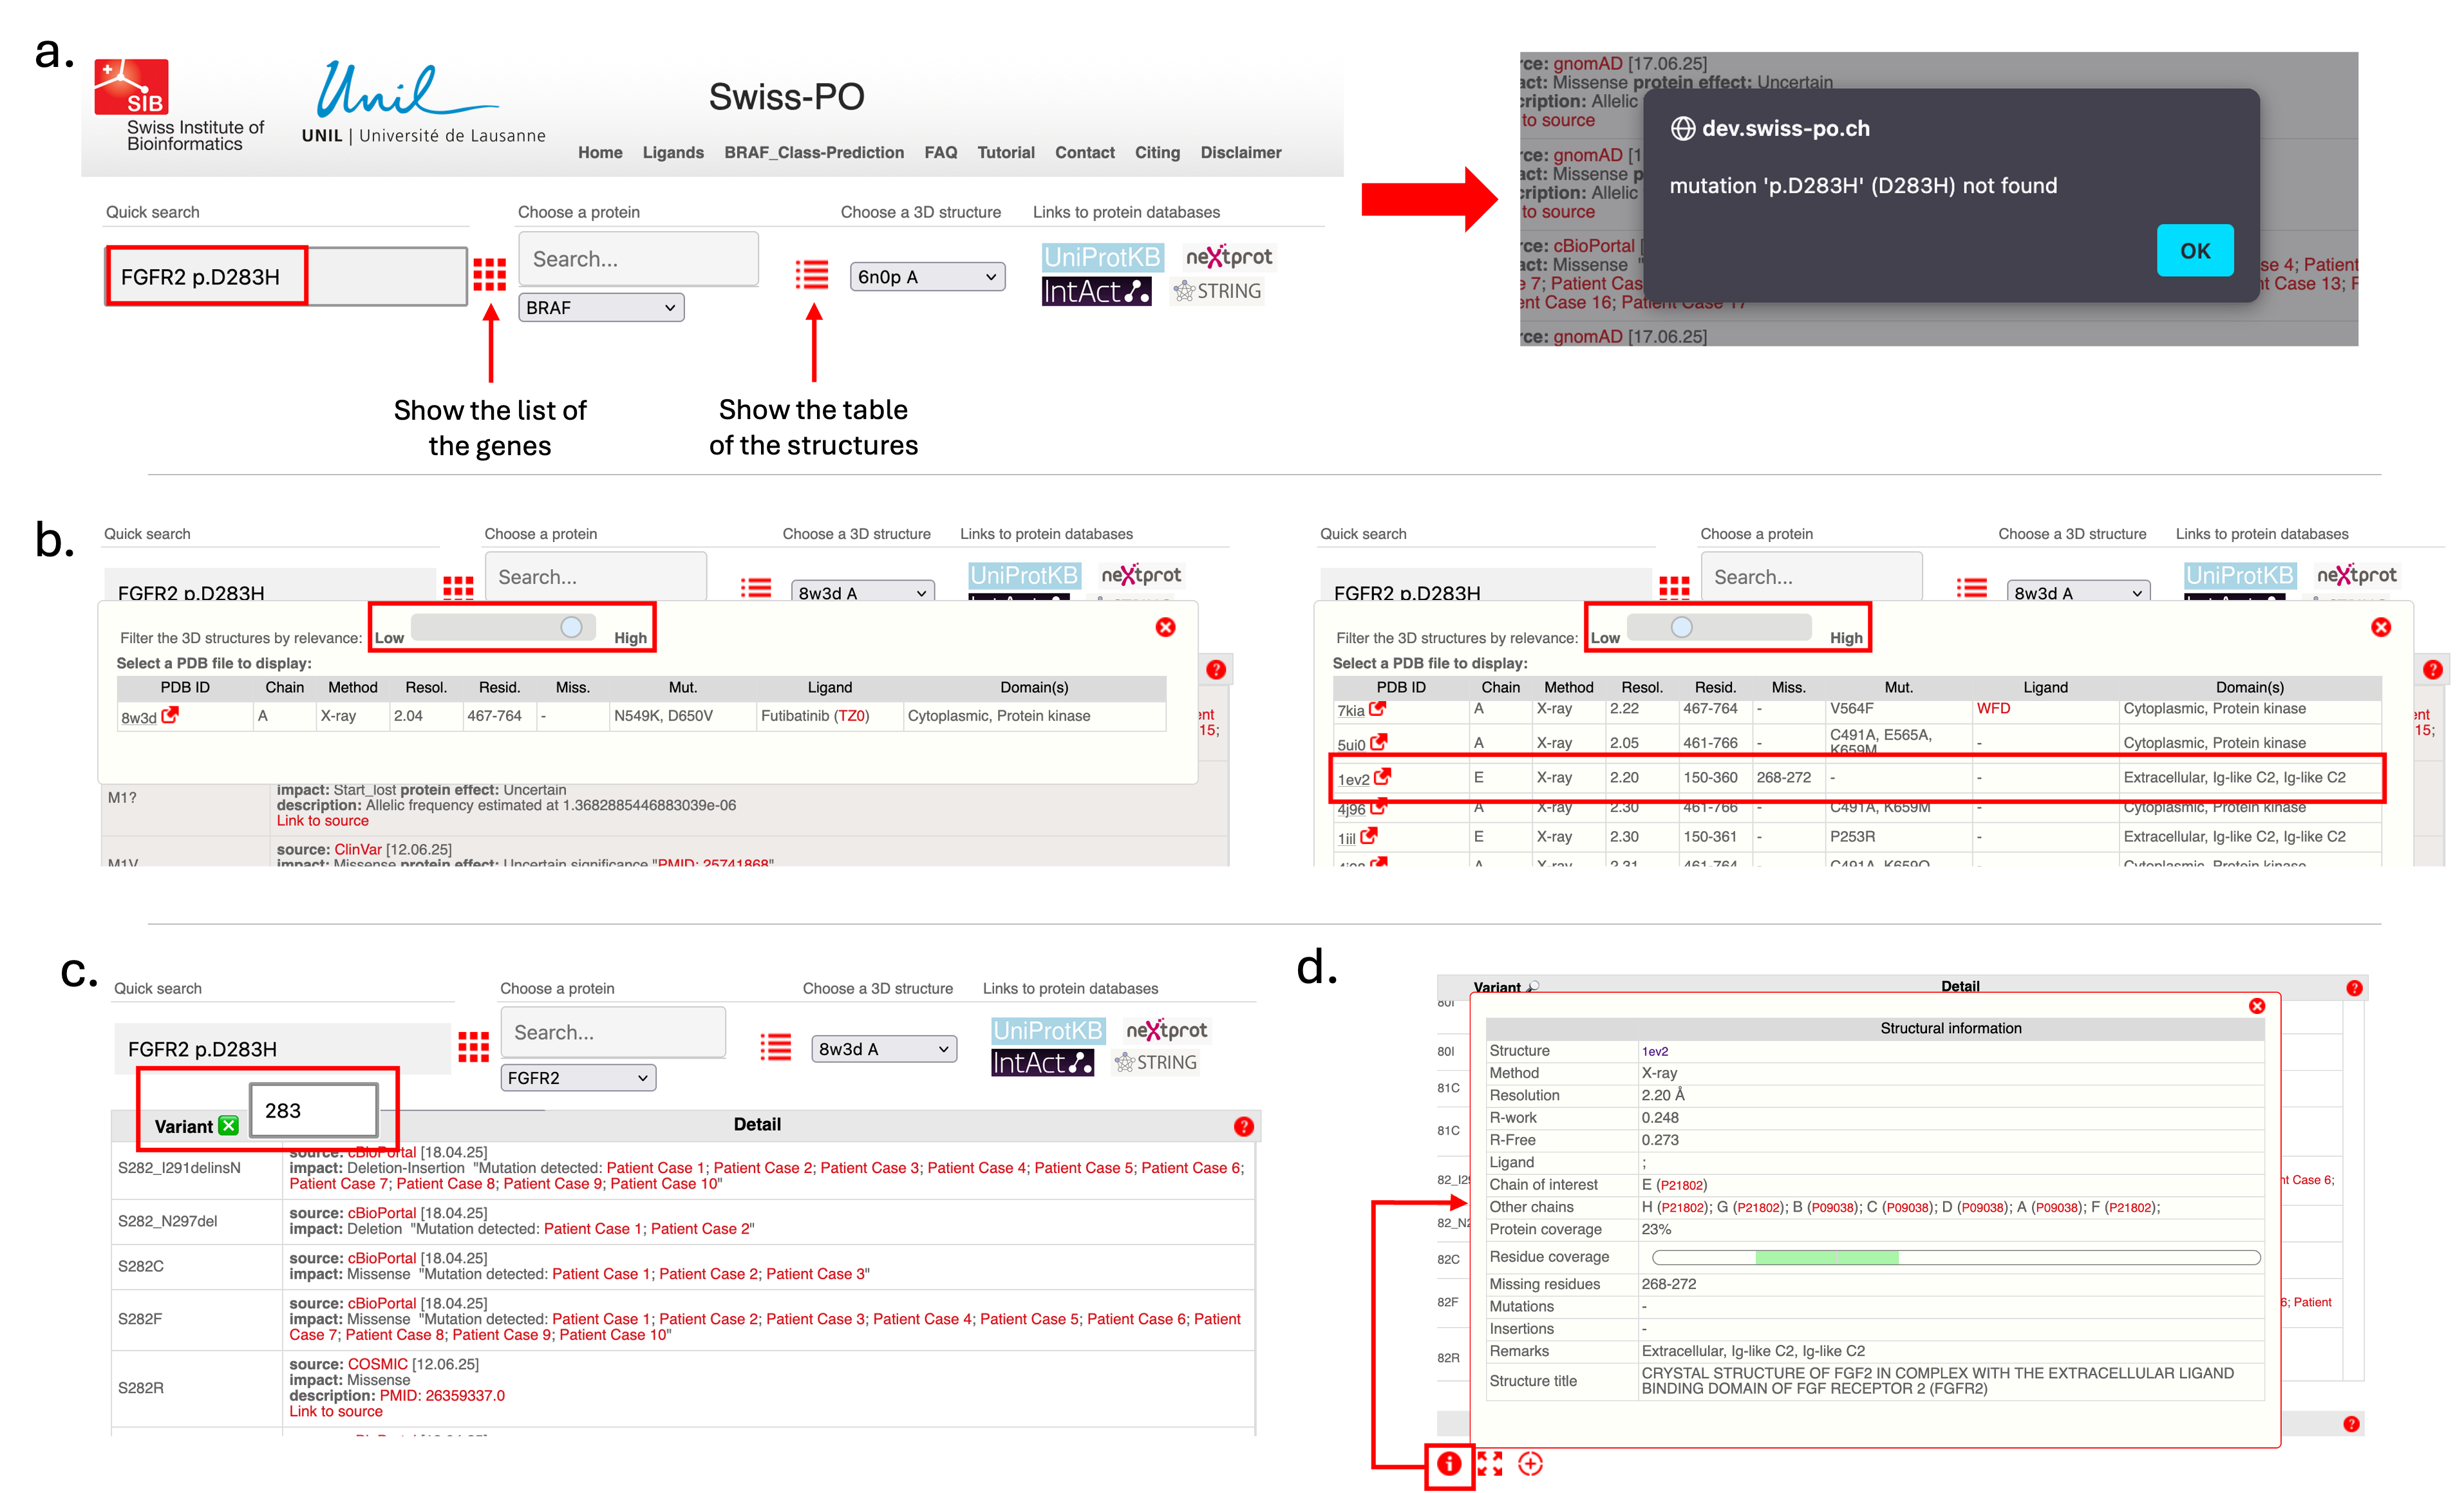
- Use the "Quick search" function.
- Enter the mutation in the corresponding field (see Figure 1.a) and click the "Enter" button on the keyboard.
- If a message indicates the mutation isn't in the database, click “OK” to proceed.
- Swiss-PO loads FGFR2 data into various interface sections.
- Swiss-PO provides links to external protein databases for more information on FGFR2.
Selecting a 3D Structure
- Choose a 3D structure where Asp283 is resolved and visible.
- Adjust the structure filter using the slider to reveal more options (Figure 1.b).
- Check the residue coverage column to find relevant structures.
- Select the experimental structure 1EV2 (residues 150–360).
- Click the red arrow next to "1EV2" to view the structure on PDBe.
Specifying the Mutation
- In the mutation table (top left), specify position 283 (Figure 1.c).
- Swiss-PO centers on nearby mutations.
- To visualize Asp283:
- Option 1: Double-click a nearby mutation in the table, then double-click the desired residue in the visualization panel or MSA.
- Option 2: Search for and double-click position 283 in the MSA directly.
Exploring Structure and Interactions
- Click the information button in the visualization panel to see structure details.
- Identify partner chains with UniProt IDs P21802(FGFR2) and P09038 (FGF2) (Figure 1.d).
- Click UniProt IDs for more information.
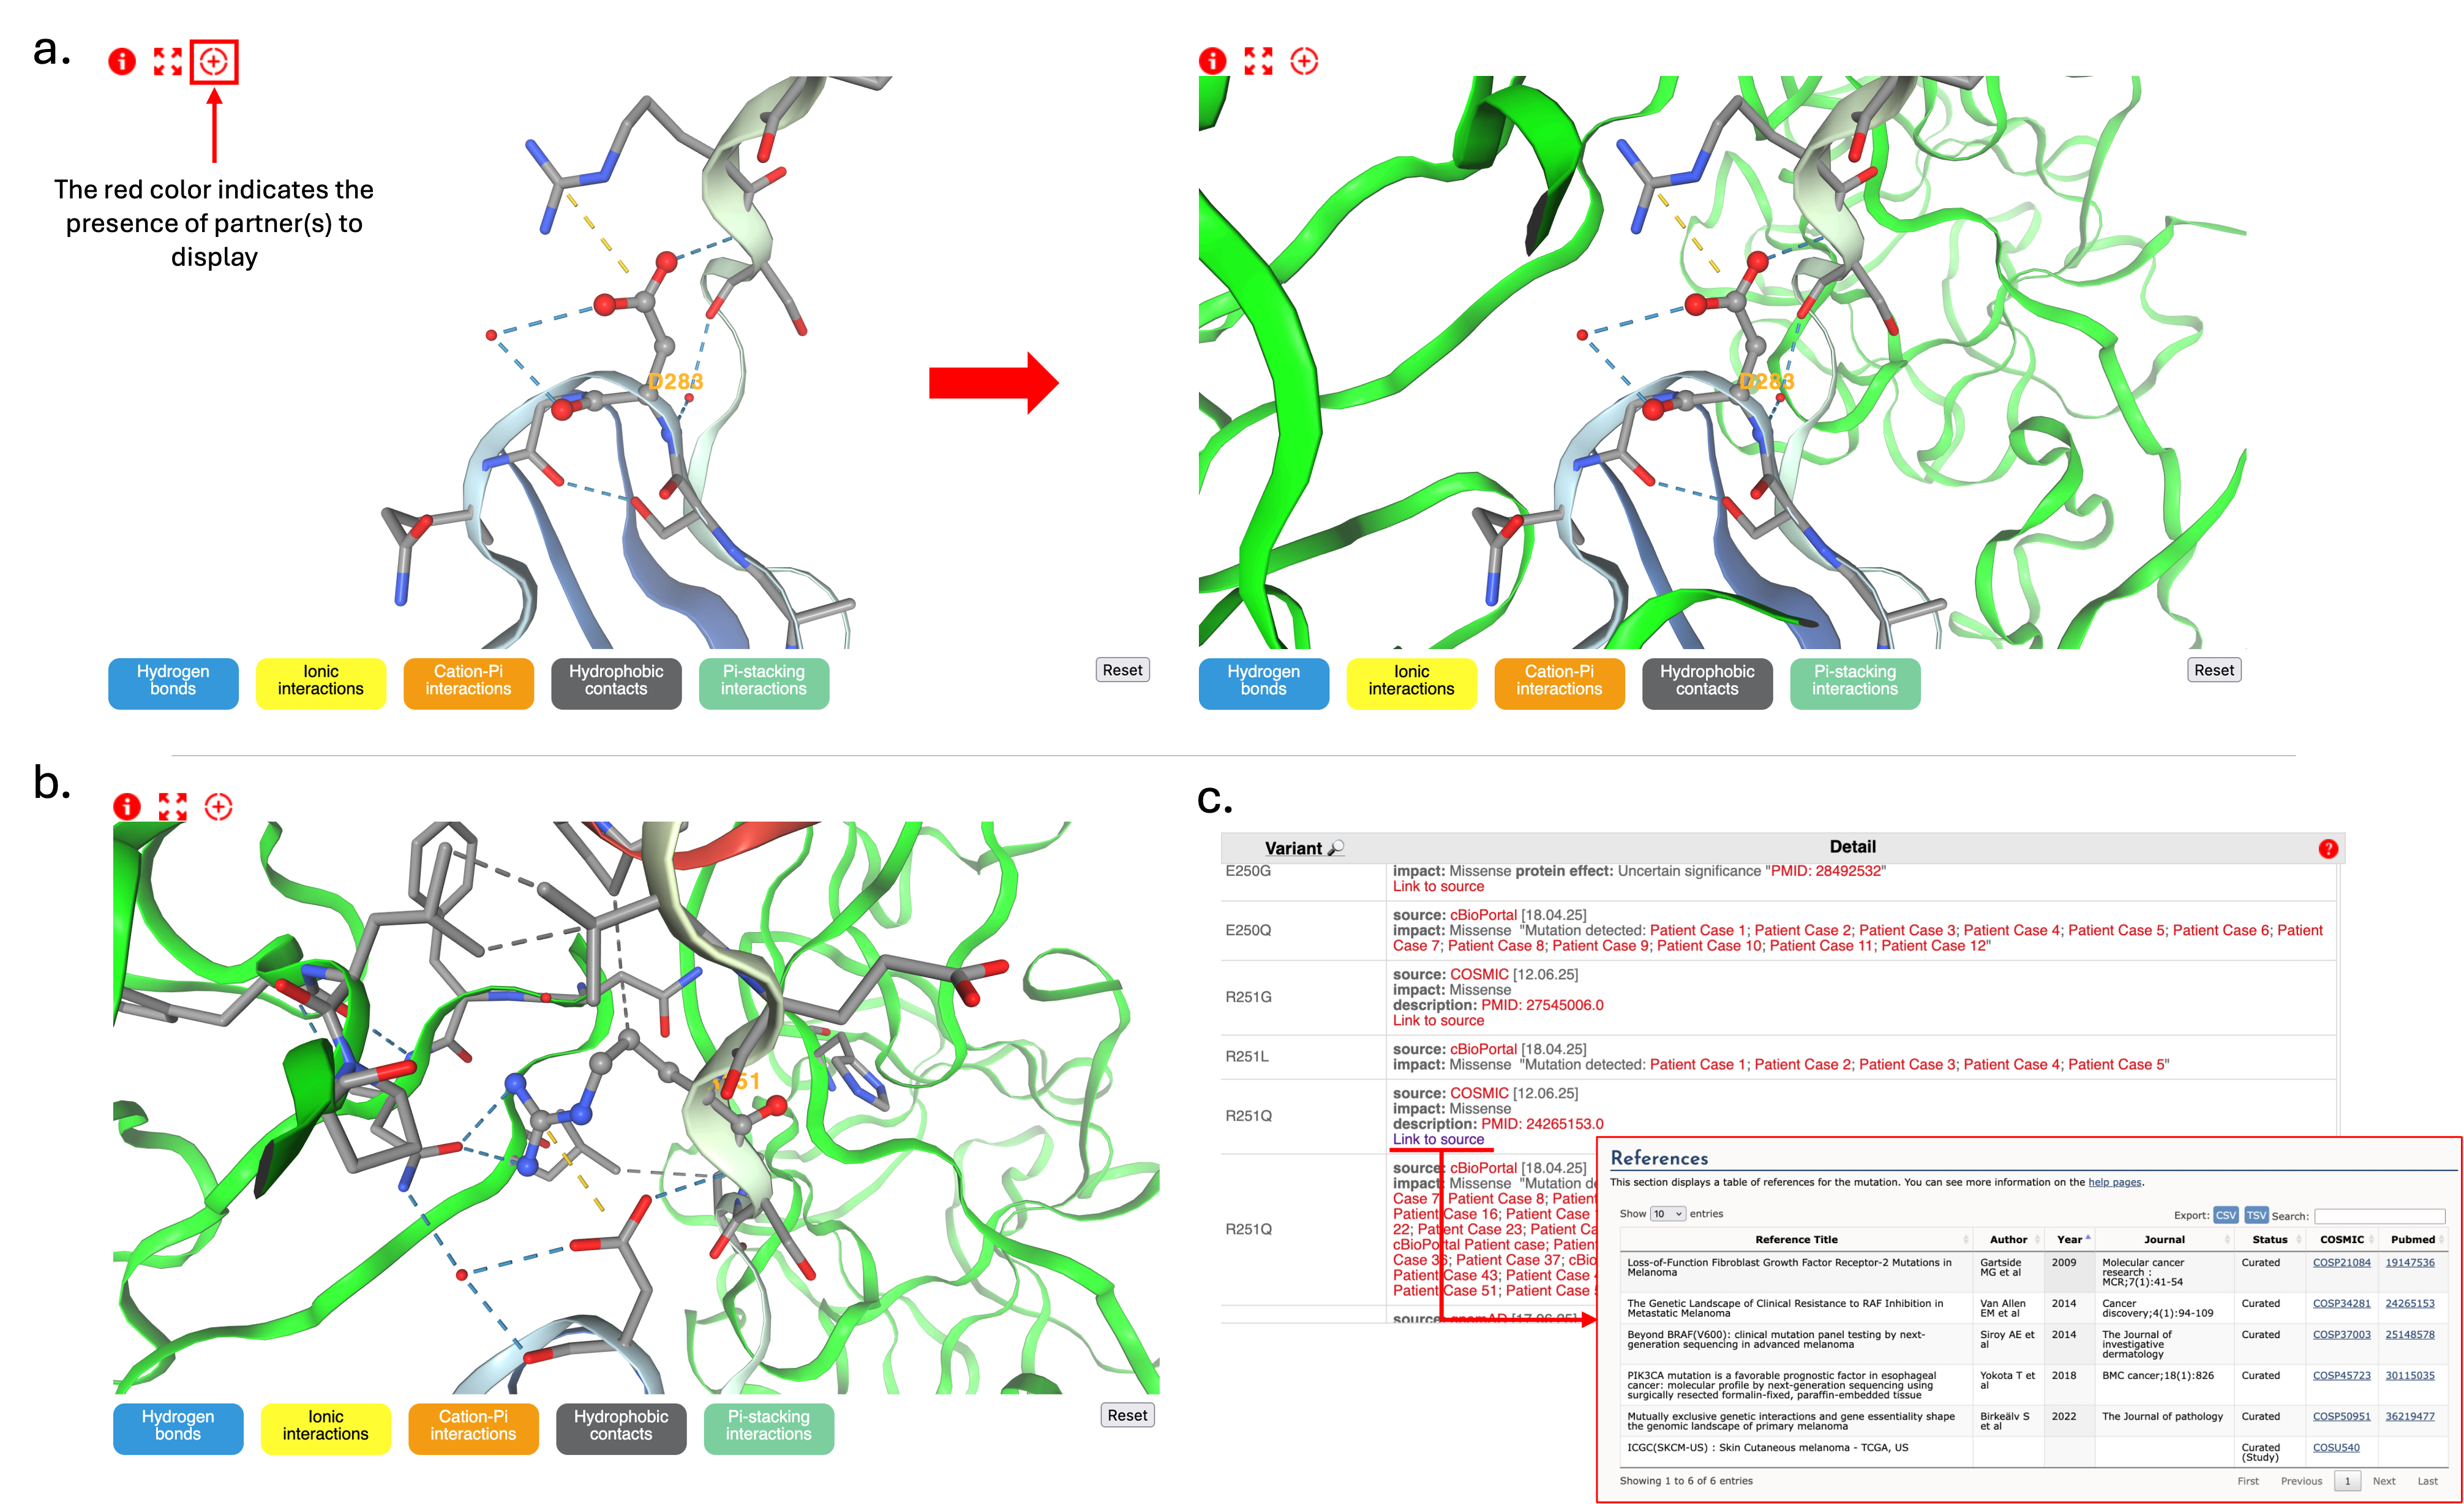
- Click the red "+" symbol to reveal additional chains/partners (Figure 2.a).
Visualizing Residue Interactions
- Asp283 appears in ball & stick representation and surrounding residues (within 5Å) are shown as sticks (Figure 2.a).
- Click buttons at the bottom to activate molecular interaction visualization and rotate/zoom to explore residue environment.
- Asp283 forms an ionic interaction with Arg251.
- Hover over residues to identify residues.
- Double-click Arg251 to highlight its role in FGFR2–FGF2 interaction (Figure 2.b).
- The mutation to histidine removes the negative charge and modify the wildtype environment, potentially disrupting interaction with Arg251.
- Predicted outcome: decrease FGFR2-FGF2 interaction due to altered binding.
Evaluating Functional Relevance
- Examine other mutations around Asp283 structural environment.
- Check mutations like FGFR2 p.Arg251Gln (Figure 2.c).
- Click COSMIC source links for detailed literature (e.g., Gartside et al.).
- Visualize positions of pathogenic mutations in 3D structure.
Sequence Conservation Analysis
- Use MSA to confirm conservation of Asp283 and Arg251 (Figure 3).
- Investigate equivalent positions in FGFR1, FGFR3, and FGFR4:
- FGFR1 p.Asp282
- FGFR3 p.Asp280
- FGFR4 p.Asp276
- Check surrounding mutations, some classified as pathogenic:

Conclusion
Based on this comprehensive analysis, the FGFR2 p.Asp283His mutation is likely damaging due to disrupted interactions with FGF2. This is supported by studies on the FGFR2 p.Arg251Gln mutation.
Final Recommendations
- Use multiple structures for a complete understanding.
- Structures vary in interaction partners and conformations.
- Integrate diverse data sources and amino acid properties for analysis (e.g., A brief guide to the twenty common amino acids).